The thinking behind The Agency.
Insights and analysis on third-party risk management, vendor security, regulatory compliance, and the agentic shift reshaping how TPRM teams actually work.
'Critical Supplier' Under the Cyber Security and Resilience Bill: Are You One, and What Happens Next?
The Cyber Security and Resilience Bill lets regulators designate individual suppliers as 'critical' — pulling them directly into scope even if they'd otherwise be unregulated. Here's what designation means, whether it could apply to you, and what suppliers and their customers should do now.
Read articleFrom the team.
 Risk Management
The Cyber Security and Resilience Bill: What It Means for Your Suppliers
The UK's Cyber Security and Resilience Bill has reached committee stage in the Lords — and for the first time, it brings your suppliers and managed service providers directly into scope. Here's what security and procurement leaders need to do now.
Read more Risk Management
DORA Register of Information: A Complete Template and Walkthrough
The DORA Register of Information is the most data-intensive obligation in the framework: 15 interlinked templates, xBRL-CSV format, and validation that gets stricter every cycle. A complete walkthrough — structure, deadlines, the failure modes from two reporting rounds, and how to build a register that passes.
Read more Risk Management
BitSight Alternatives for Mid-Market and Regulated Firms (2026)
Bitsight is built for the enterprise — which is exactly why mid-market and regulated firms go looking for alternatives. Seven platforms compared for 2026, with honest verdicts on data depth, regulatory reporting, pricing and fit.
Read more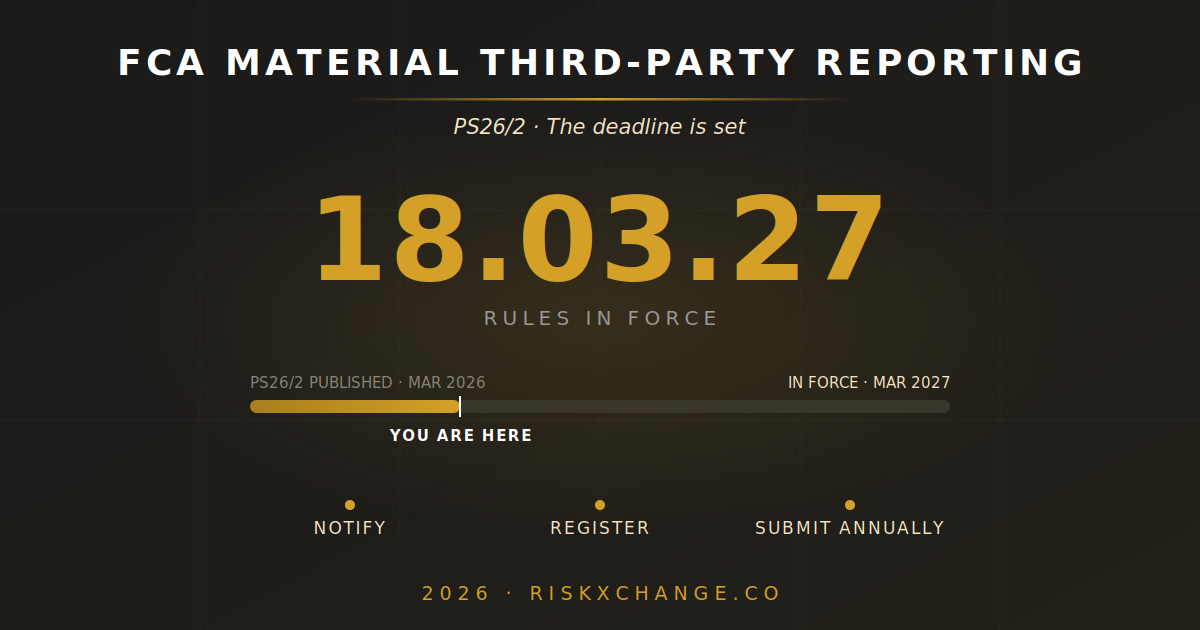 Risk Management
FCA Material Third-Party Reporting: Preparing for the March 2027 Deadline
The FCA's material third-party reporting rules under PS26/2 come into force on 18 March 2027. Here's who's in scope, what counts as "material", what the register demands, and a month-by-month preparation plan that starts now.
Read more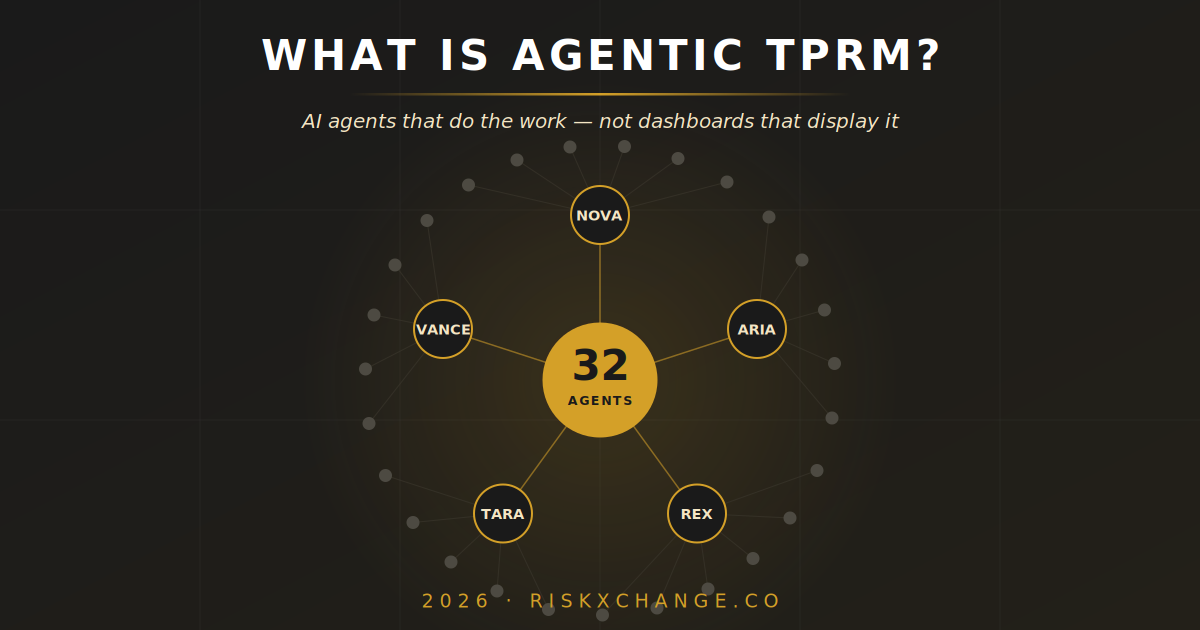 Agentic AI
What Is Agentic Third-Party Risk Management?
Agentic third-party risk management uses autonomous AI agents to run the TPRM lifecycle — assessment, monitoring, remediation and reporting — rather than software that helps humans do it. Here's what that means in practice, and how it differs from automation.
Read moreStop reading. Start running TPRM differently.
Book a 30-minute call and we'll have NOVA, ARIA and REX produce a complete posture report on a vendor of your choice inside 24 hours.